
Every year about this time, someone grumbles that The Chase needs a road course. The frequently-cited rationale is that the regular NASCAR season has two, so a champion should prove he or she can perform on the same racetracks that make up the regular season.
This seemed like one of those things you can solve with data. Is the Chase really reflective of the overall NASCAR season? Let’s start by classifying the tracks. I broke them down as follows:
| Track Type | Tracks Included |
| Short Tracks (less than a mile) | Bristol, Martinsville, Richmond |
| 1 to less than 1.5 miles | Darlington, Dover, New Hampshire, Phoenix, |
| Intermediate (1.5 mile) | Chicago, Kentucky, Atlanta, Texas, Charlotte, Homestead |
| 2-2.5 mile | Indy, Pocono, Michigan, California |
| Superspeedways | Daytona, Talladega |
| Road courses | Watkins Glen, Sonoma |
Then I went through and counted.
Twice.
Because I have counting issues.
| Track Type | Regular Season | Chase | Total | |||
| Short Tracks (less than a mile) | 4 | 15.4 | 2 | 20.0 | 6 | 16.7% |
| 1 to less than 1.5 miles | 5 | 19.2 | 2 | 20.0 | 72 | 19.4% |
| Intermediate (1.5 mile) | 6 | 23.1 | 5 | 50.0 | 11 | 30.6% |
| 2-2.5 mile | 6 | 23.1 | 0 | 0 | 6 | 16.7% |
| Superspeedways | 3 | 11.6 | 1 | 10.0 | 4 | 11.1% |
| Road courses | 2 | 7.7 | 0 | 0 | 2 | 5.6% |
I know we usually break things into small, intermediate and big, but let’s take a little more detailed look, okay?
Of course, it’s not science without colorful graphs, right? Let’s start by looking at the distribution of races throughout the whole season. As you can see from the pie chart….

… a NASCAR season is pretty well balanced. You’ve got a little more 1.5 mile tracks, but there are more 1.5 mile tracks out of the tracks NASCAR runs than anything else, so that makes sense in terms of supply and demand. Now let’s compare that to the regular (first 26) and chase (last 10) races.
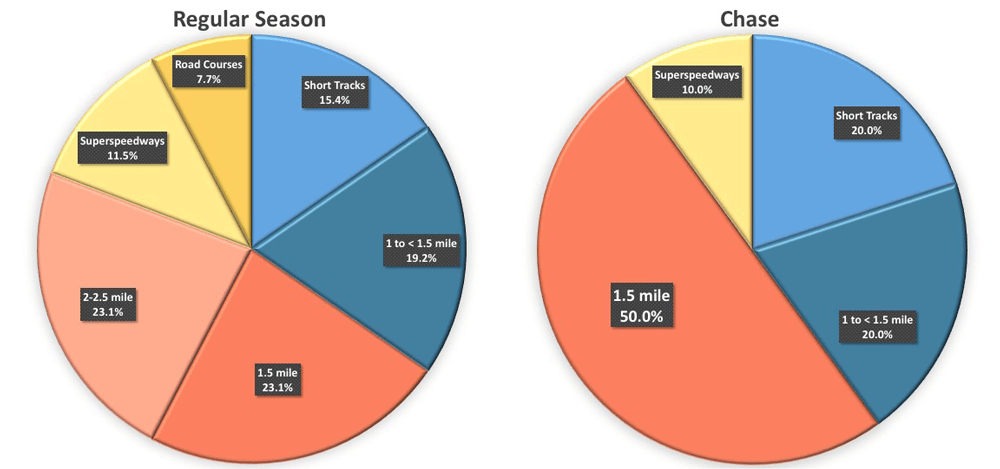
So I thought this was pretty interesting. We knew that 1.5 mile tracks make up half the chase, but in addition to there being no road courses, there are also no 2-2.5 mile tracks. There are about the same proportion of superspeedways, short and 1-1.5 mile tracks, but the places that would have been taken by a road course and a 2-2.5 mile track is replaced by 1.5 mile track.
The husband said that trying to compare pie charts was too confusing, so I also put this together in terms of a bar chart. The legend turned out a little small, so I’ll note that the light green is the regular season, the blue is the chase and the purple is overall (a weighted average, since there are 26 races in the regular season and only 10 in the chase.)

Let’s Fix This!
Okay, let’s go on the assumption that The Chase, in order to crown a real champion, should reflect the regular season. What do you change out?
Here’s the problem. The Chase happens in September, October and November. Where are all the 2-2.5 mile tracks? In the Northeast or Midwest. Pocono in November would take a huge chance in terms of weather. There’s California and you could pair that up with Phoenix to make a mini West-coast trip. Given that the racing’s been so much better there lately, that might be an option. But I’ll tell you, come the last couple races of the season, everyone is exhausted. The logistics of getting two cars out to the west coast are complicated and everyone is just bushed.
There’s the same problem with the road courses. Watkin’s Glen in the fall is iffy and Sonoma brings up the whole West Coast argument again. Road Atlanta would work… but then we into the question of taking a race away from another track.
Miscellany
I got curious about the geographic distribution of races, so I tallied that up as well. Not surprisingly, the majority of the races are run in the Southeast, as befits a sport that originated in the Southeast. I did do the pie charts for Regular Season vs. Chase – but the distribution really doesn’t change, so I decided not to include those. (It takes time to make these things!)

I also looked at the distribution of the Nationwide series compared to the Sprint Cup Series. Since they run together at a lot of tracks, I expected it to be pretty close. It was.

Be the first to comment